T Coronae Borealis Finder Chart.pdf
Coronae Borealis (CrB) All Sky Charts for
1-April, 1-May, 1-June, 1 July, 1-Aug, 1-Sep
It is a very rare thing to be able to predict an exploding star, but astronomers are doing just that. When Tycho Brahe observed a naked-eye star where none had been there before, in 1572, he called it “nova,” because he thought he was seeing the birth of a new star. In fact, he was observing the death of a star.
Today we broadly characterize exploding stars as a nova or supernova. A supernova can be 4 billion times the luminosity of the Sun for a few weeks. A nova can achieve a luminosity of hundreds of thousands of Suns for a few days. While not as bright, a nova can repeat the same trick many times whereas a supernova is a one-time event. A typical time interval between explosions is normally many thousands of years. However, there are a very few stars that are known to erupt on a timescale more friendly to humans. T Coronae Borealis is one of those stars.
After erupting in 1866, It returned to its normal brightness. On February 10, 1946, the star appeared more than 600 times brighter than it did the week before. Analysis of the brightness of T Corona Borealis shows that the year before the explosion, the star dims. T CrB began its dimming phase in March, 2023. When T CrB does go nova, it is expected to be easily seen with the naked eye, even from large cities. It probably will not remain bright enough to see without a telescope for more than a few days.
This will be the most watched star in the sky for the next few months, with the possible exception of the Sun. Will you be the first to see it?
Currently At The Observatory
April 14, 2024 through September 5, 2024


A Note of Explanation Regarding Astronomical Magnitudes and Colors
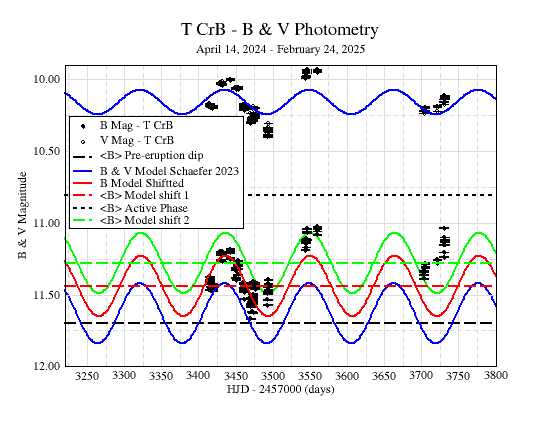
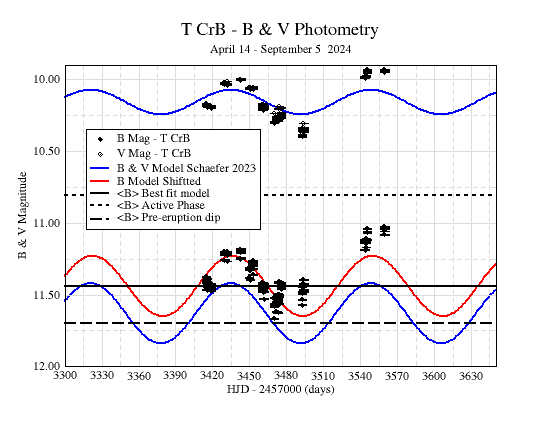
MacAdam Observatory has been able to complete 2 sets of data for T CrB, from April 14 through September 5, 2024. We used the Blue (B), Green (V), Red (R) and Infrared (I) filters. The figure shows the magnitudes in the B & V filters.
The T CrB system is a red giant star (RG) orbiting a white dwarf (WD). Currently gas is being pulled from the surface of the RG and spirals around the WD in an accretion disk. This gas eventually finds its way to the surface of the WD where it accumulates. The gas is mainly composed of hydrogen. In the extreme temperature and pressure on the surface of the WD, the hydrogen reaches a critical mass and a thermonuclear explosion occurs. This is the nova eruption.
As gas is stripped, the RG becomes more "teardrop" shaped, with the pointy end of the teardrop always pointing toward the WD. As they orbit each other, there is a time when we see the teardrop shape, (when the line between the RG and WD is perpendicular to us) and a time when we see the back or front side of the RG. When we see the teardrop shape the RG appears brighter because there is more surface area for us to see. This results in a maximum in the light. When we see the back or front side the light is minimum. It takes a total of 113 days to go from one maximum to the next. After two maxima the system has completed one orbit.
In our new figure we see that our B & V magnitudes went through a maximum on May 4, 2024. The figure shows a model of the expected magnitude changes from the paper by Schaefer in 2023. https://academic.oup.com/mnras/article/524/2/3146/7077557 . The model is represented by the solid blue lines. We can see that our V magnitude data matches fairly well with the model. Deviations from the model are caused, in part, from flickering in the RG. This is kind of like the variations we see in videos of the Sun's surface, where bright eruptions occur at times.
For the B magnitudes, our MacAdam Observatory values are brighter than the blue model. To match our data we had to shift the model to an average B value of 11.44. This is the red solid line. The solid black line shows where this average is located. At times, T CrB becomes very active and the dotted line shows where the average B magnitude would be if T CrB was in an active phase.
Notice: Our most recent data in August and September is indicating that both B and V magnitudes are getting brighter (small magnitude value).
What about the EXPLOSION???
In 1946, when T CrB erupted last, there was a dip in brightness that occurred a couple months before the nova eruption. The level of the B magnitude at that time was B = 11.7. This is shown as a dashed line near the bottom. At the moment it appears from our data that T CrB has not reached this dip value and is in fact well above it. If the eruption occurs like it did in 1946, we can probably expect a couple more months until the eruption.
New Data: Our most recent data in August and September is showing that T CrB is brightening. This could indicate that it is headed into a new "active" phase. If this is the case, we are not expecting T CrB to erupt in the coming months. Maybe 2025...
This is what we are predicting from our continuing observational campaign at MacAdam Student Observatory.
More to come....
March 28, 2024
Current researches by Dr. Ron Wilhelm include observing a type of variable star known as RR-Lyrae stars, named for the prototype star, the variable labeled RR in the constellation of Lyra. This star in the constellation Lynx is about 100 times too faint to be seen without a telescope. The star is pulsating, in and out with a period of about 6 hours wherein it becomes 45 % brighter than its minimum.
Light curve of the variable star, TV Lynx (a.k.a TV Lyn). The blue data points show the rapid increase in brightness for TV Lyn, compared to stable reference stars (other colors). Tonight, we observed the compression hump (near UTC = 0.67 days) and the maximum light (near UTC = 0.7 days). The compression hump is due to extra light being emitted because of collisions between infalling outer layers and outward moving, inner layers. We are studying this star to search for changes in the pulsation period, the time it takes to finish one pulsation cycle (~ 0.24 days).

